41 Introduction to Epidemiology
This chapter is under heavy development and may still undergo significant changes.
Up to this point, this book has primarily been about R programming and data management. We tried to create examples and scenarios that would resonate with epidemiologists and other people who are interested in epidemiology, but there was very little information in the previous chapters that can reasonably be said to teach a person much about epidemiology as a discipline or how to engage in the practice of epidemiology. From this point on, we will shift focus slightly from learning about R generally to learning about how to use R as a tool for grasping the concepts, and conducting the analyses, that are central to the practice of modern epidemiology.
This book isn’t intended to be a broad introduction to epidemiology. If you’re reading this, we assume that you’ve already had some exposure to the basics of epidemiology. If you haven’t had any exposure to the basics of epidemiology, Epidemiology by Leon Gordis is a popular introductory textbook and we recommend that you start there. Alternatively, you could read Modern Epidemiology by Lash, VanderWeele, Haneuse, and Rothman, which is our personal favorite, but is also regarded as a challenging text by some.
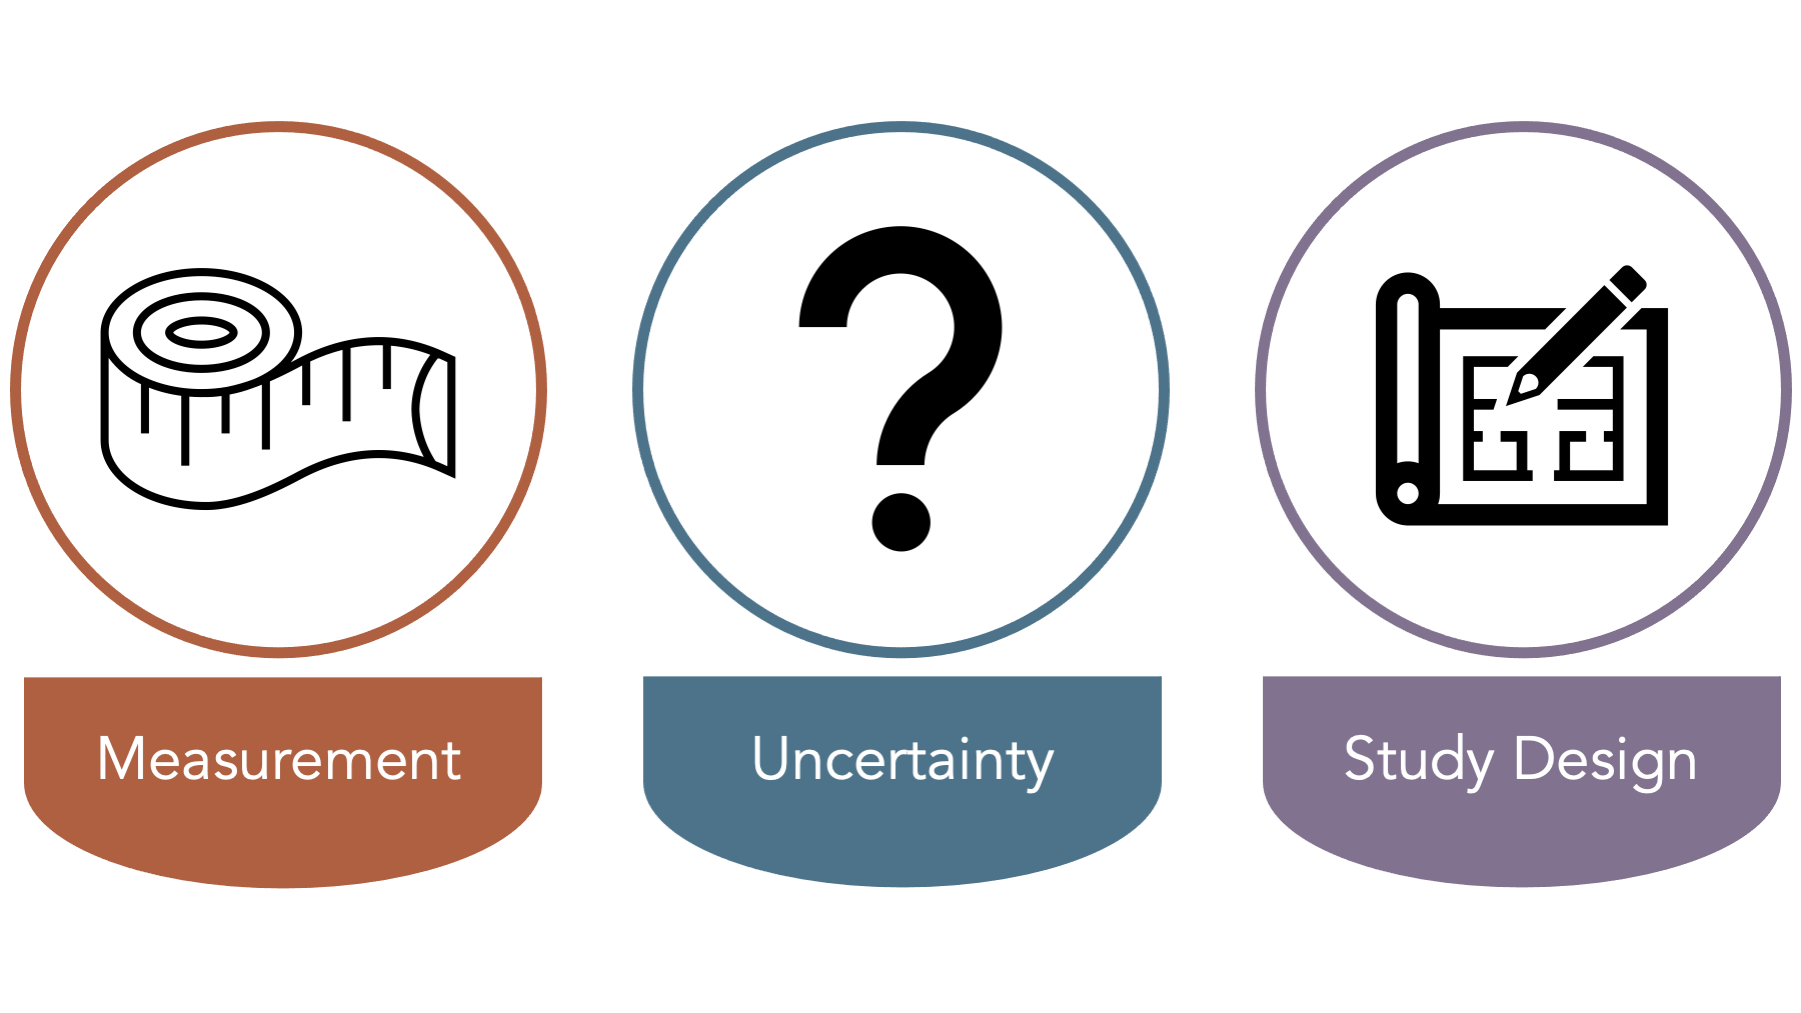
Having said all of that, in this chapter, we will briefly touch on some foundational epidemiologic concepts as they apply to this book. Specifically, we will start by discussing measurement, uncertainty, and study design.
41.1 Measurement
Epidemiology is typically defined as something like the following.
“the study of the occurrence and distribution of health-related states or events in specified populations, including the study of the determinants influencing such states, and the application of this knowledge to control the health problems.”16
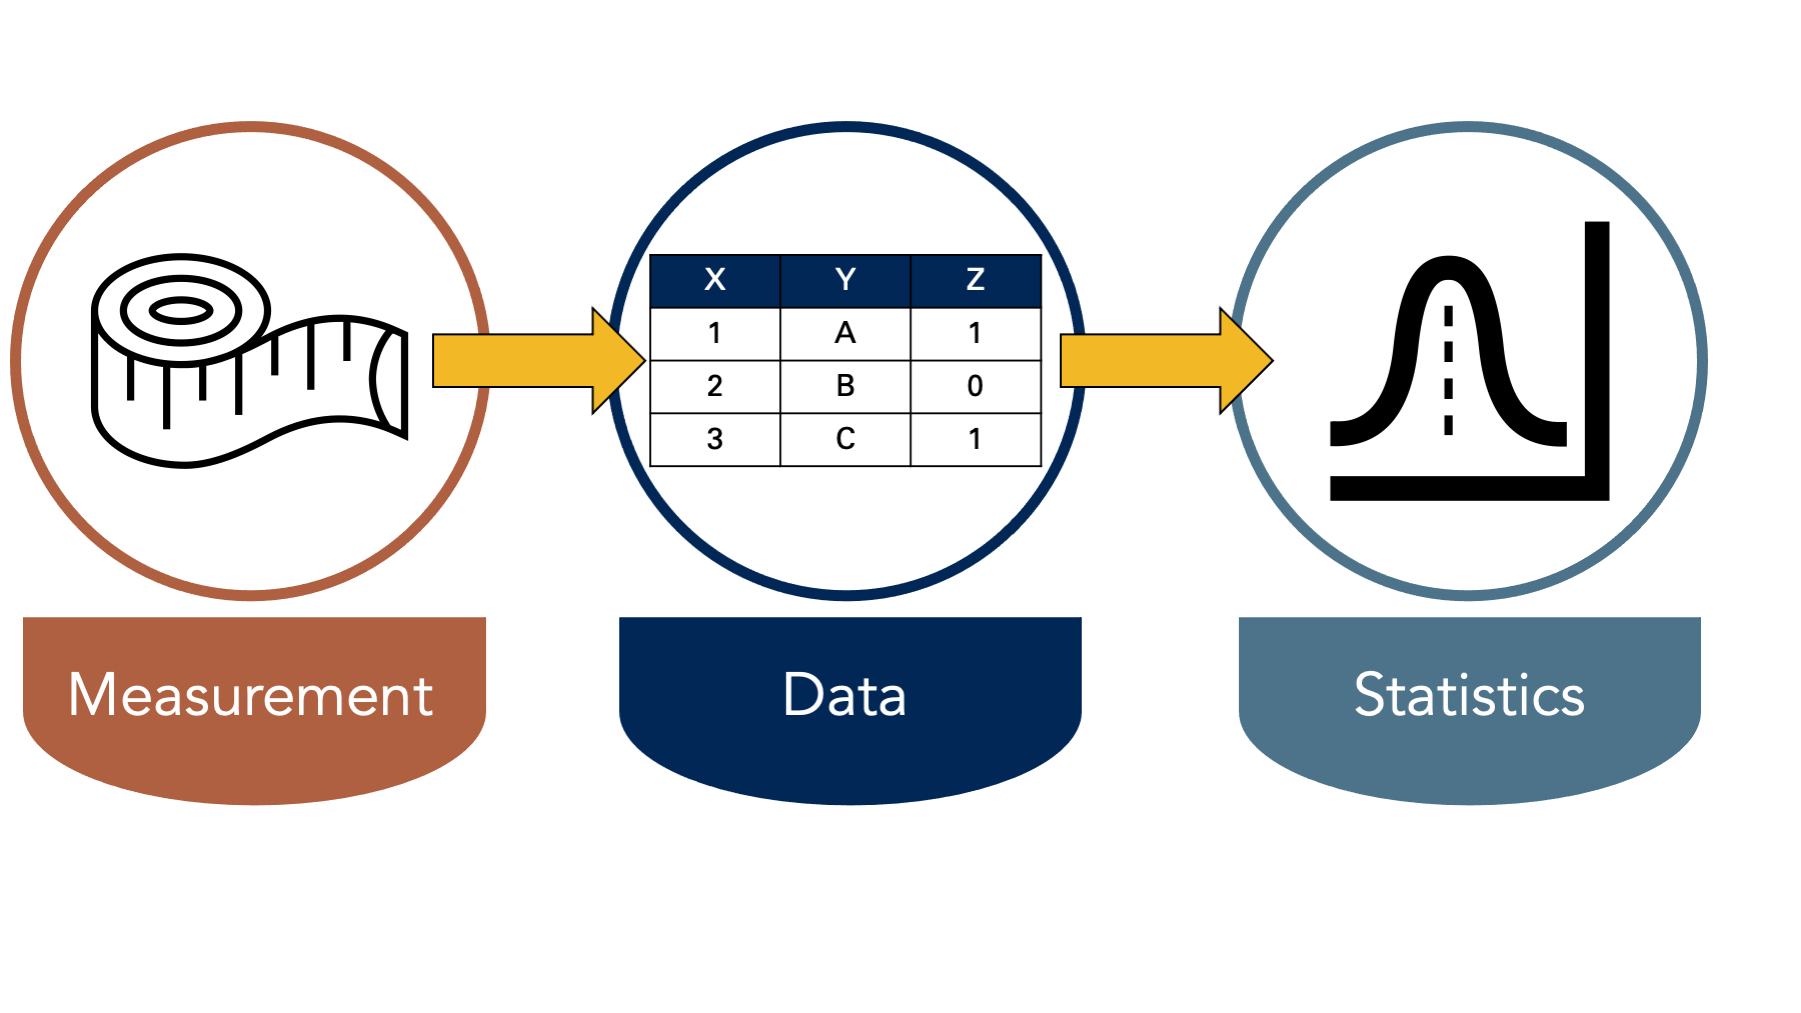
For shorthand, we sometimes say that we study, “who gets sick (or stays healthy) and why.” Because this isn’t an introductory course on epidemiology, we’re not going to attempt to pick apart all the nuances of either definition. However, it may be worth taking a step back and thinking about how we study the occurrence and distribution of these health-related states. Do we consult powerful oracles or deities? Not typically. Do we go into a deep meditative state until the answers just occur to us? Not typically. At least, doing that alone would not typically be very convincing evidence to most people. Instead, we almost always study health-related states in Populations by measuring some characteristics of those health-related states that are thought to be relevant. Then, we look for useful patterns in those measurements. Recording those measurements typically results in data and we typically look for useful patterns by applying statistical procedures to the data. Hence, data and statistics are probably the two most commonly used tools in most epidemiologists’ toolbox.
To be even more specific, when we say that we are “measuring characteristics of health-related states,” we mean that we are recording numerical or qualitative values somewhere as we observe varying quantities or qualities of those characteristics. For example, we might ask someone to step on a scale. We could observe their weight and record it somewhere. As another example, we might ask someone to fill out a questionnaire about their thoughts and feelings. We could then record those responses somewhere as well.
🗒Side Note: Notice how we frequently use the word “observe” in epidemiology. In everyday speech, we tend to think of observe as meaning seeing something take place in front of our own eyes. In epidemiology, it is common to use the word observe more broadly. Something closer to simply meaning ”to be aware of” or ”have knowledge about”.
Sometimes, the values we observe are more or less dictated by nature (e.g., a person is currently 71 inches tall or is not), while others are socially constructed (e.g., race), and sometimes they are assigned somewhat arbitrarily (e.g., mild, moderate, and severe pain). Note that what we measure, how we measure it, and how we interpret different measurements we collect are driven by what we believe to be important, and make up part of the assumptions we bring to the research process. This subjectivity should give all of us some pause. While this is not an ethics or philosophy textbook, it is important to point out that data is not value-neutral. If we want to do this work well, we should take the time to think through the assumptions we bring to the table.
A potentially helpful way to frame this discussion is to think of epidemiologists as storytellers. We tell stories about how different things impact people’s health, and we tell stories about how their health is impacted. What makes us different from some other storytellers is our heavy reliance on quantitative data to help us tell those stories about population health. If that all sounds a little too “deep” to be meaningful, we think the relevant takeaway for now is that a typical day in the life of most epidemiologists includes attempting to describe, predict, and/or explain health-related phenomena. We will spend most of the rest of this book discussing how to do so.
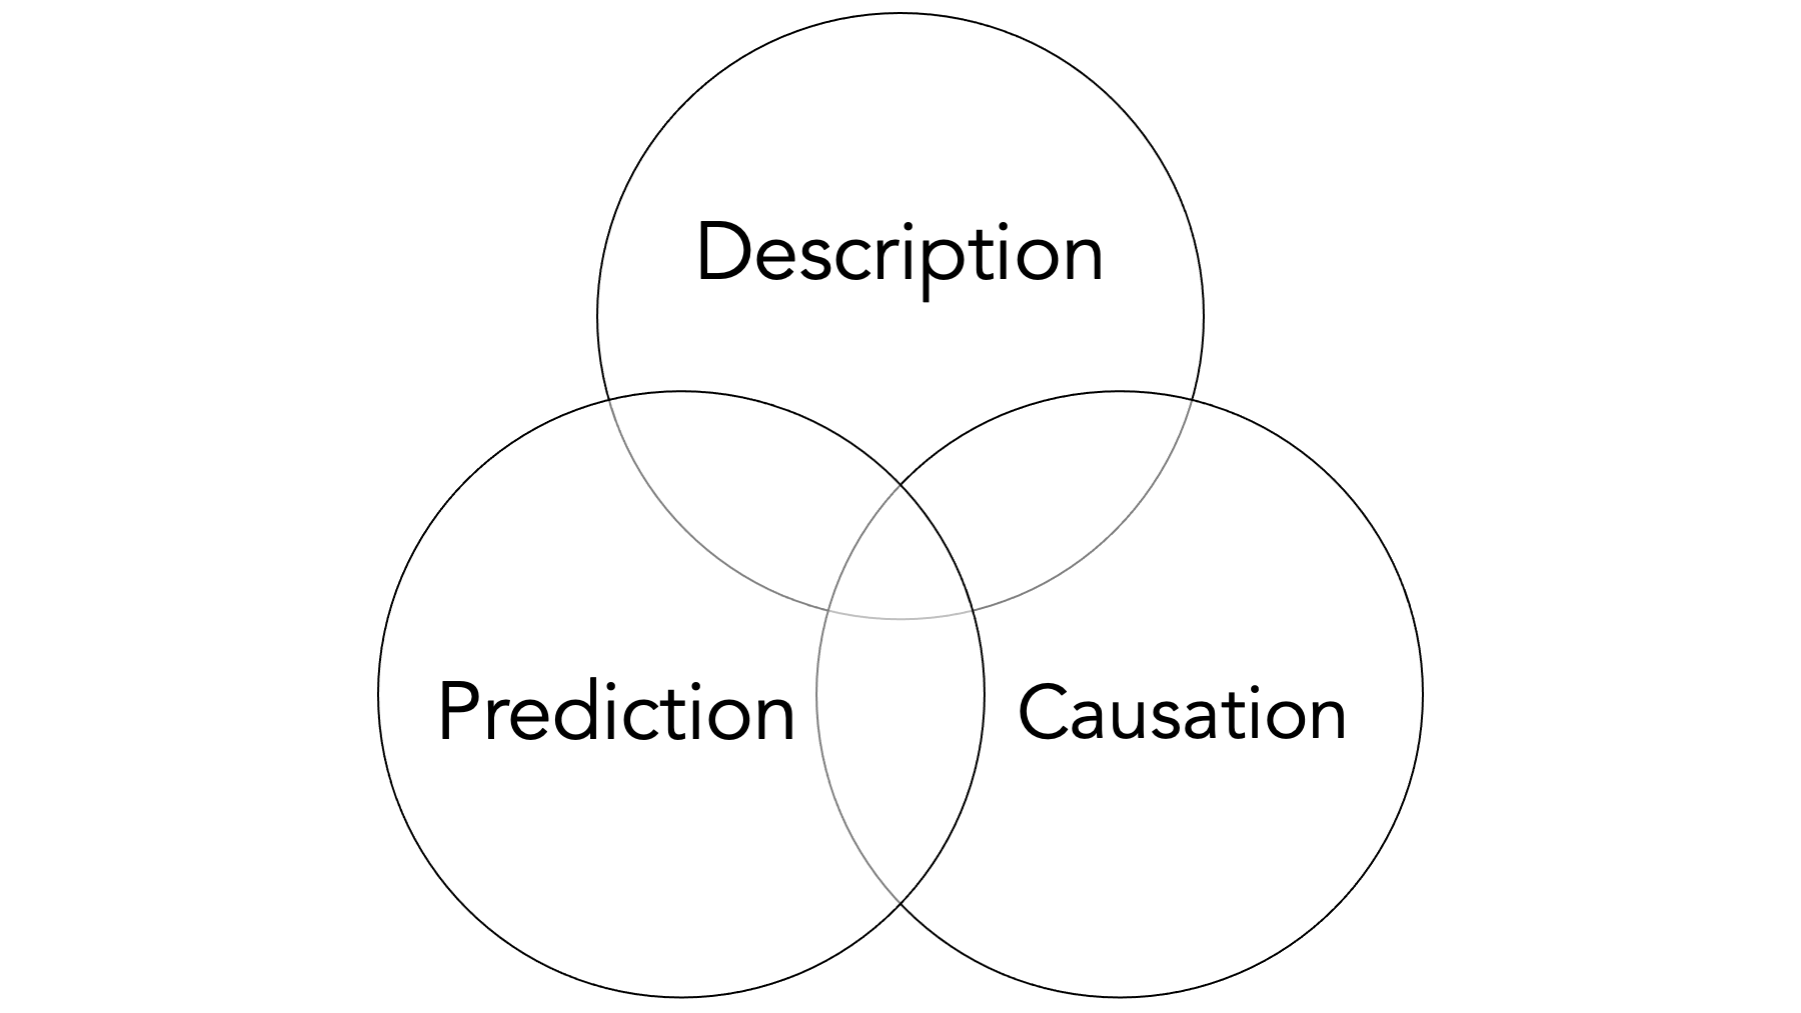
We may be able to dig a little bit and find some technical definitions somewhere that clearly distinguish each of these measurement and analysis goals, but in our experience there is often some overlap between them in applied epidemiology. Further, the same study may attempt to do all three to varying degrees. Having said that, we believe that there is some value in taking a moment to discuss each individually.
41.1.1 Descriptive measures
When we say “describe” in the context of analysis, we are not necessarily looking for associations in the data between two or more variables. Sometimes, we are simply looking at the distribution (i.e., middle, spread, shape, count, proportion) of a single variable or measure. Typically, this is done in the context of resource management and planning, or while conducting exploratory analysis.
For example:
How many ventilators are available in Texas?
What is the average age of people living in Florida?
How much time elapses, on average, between exposure to a pathogen and occurrence of disease symptoms?
However, there are also times when we want to compare the distribution of one variable within levels of another variable. Most people would consider these comparisons to be equivalent to measuring associations. You could also make the case that this starts to overlap with prediction. It sort of just depends on how the information is being used.
For example:
Are there more ventilators available in Texas or New York?
Are people older, on average, in Florida or Pennsylvania?
Is symptom onset quicker, on average, for Cholera or E. coli?
You can generally think of measures like incidence, prevalence, and odds as descriptive, and we will discuss them in greater detail later in the book . Often, these descriptive measures can be extremely useful in their own right, but they are also used as a foundation for hypothesis generation, prediction, and causal explanation as well.
Prediction and causal explanation will be the topic of future modules.
41.2 Uncertainty
In epidemiology generally, and parts of this book specifically, it is important that we become comfortable with uncertainty. What do we mean when we say “uncertainty”? In epidemiologic research (and quantitative research more generally), we actually need to get comfortable with uncertainty in a few different ways:
- Statistical uncertainty.
- Uncertainty in the research process itself.
- Epistemological uncertainty.
41.2.1 Statistical uncertainty
We should get comfortable with uncertainty in the statistical sense, which is something we will try to measure and quantify. Indeed, it may be an oversimplification, but not entirely inaccurate, to define statistics as the science of quantifying uncertainty. In the chapters that follow, we will discuss statistical uncertainty in more detail. For now, it is important to understand that even when everything goes well our estimates are not perfectly precise. Statistical estimation does not give us the “right” answer, but helps understand what is most plausible based on our data. This is often a challenge for new students of epidemiology who are used to taking math classes where there is just one correct answer to a problem. As an epidemiologist, it is important to get comfortable with statistical uncertainty because of how heavily we rely on statistical methods to make sense of quantitative data.
41.2.2 Uncertainty in the research process
In a very practical sense, all students of epidemiology (including the authors) must get comfortable with a lack of certainty in the research process itself. Epidemiology is not a series of check-lists and procedures. Students often wish that there was a simple checklist or algorithm that we can follow that will always lead us to the correct answer. But epidemiological inquiry does not work that way. In reality, we rely on (sometimes untestable) assumptions to inform how we conduct research (we will return to this again when we discuss DAGs). A common phrase in our classrooms is “don’t let the data do the thinking for you.” Ultimately, the quantitative analyses discussed in this book are just one part of the process of making a well-reasoned (ideally) scientific argument about the research question under study. Clear-cut procedures that provide valid and reliable, black and white answers are the exception rather than the rule. On the bright side, this should also provide us with some measure of job security for the foreseeable future. If epidemiology could simply be reduced to a checklist or algorithm, then our jobs would almost certainly be outsourced to computers in no time.
41.2.3 Epistemological uncertainty
We have to get comfortable with uncertainty on the level of our conclusions. In epidemiology, the questions we are called to answer are often causal questions (e.g., Did this cause that? If we stop this, can we stop that?). On the one hand, these questions are usually incredibly exciting and have the potential to lead to real, tangible changes in population health. On the other hand, our two primary tools, data and statistics, are not sufficient to answer such questions in and of themselves.
The conclusions that we are able to make are almost always loaded with caveats and assumptions. This is true even for many non-causal questions. However, the questions being asked are often so important that we don’t have the luxury of completely deferring our conclusions until some imaginary later date when the stars align, and the inner workings of the world are magically revealed to us with complete clarity. No, we must often do our best with the information and resources that are available to us now. Therefore, when we make conclusions, we will have to be comfortable with the fact that they may be wholly or partially incorrect, there may be important exceptions, and we may have to revisit them again in the future when circumstances, or the information available to us, changes. Even when they are entirely correct, we will often not be able to prove as much with complete certainty. Said another way, our conclusions will rarely, if ever, be exactly correct or provable; however, sometimes they will still be useful for a given purpose.
That is an unsettling thought for many people, but it is true nevertheless, and we must become comfortable with it if we want to practice epidemiology. If it makes you feel any better, the history of public health, including epidemiology, is littered with notable examples of useful conclusions that were not entirely correct or not entirely proven, yet still extremely useful. For example, citrus fruit to prevent and cure scurvy, drinking tainted water as a cause of cholera infection, and tobacco smoke as a cause of lung cancer (and many other diseases).
41.3 Study design
So, let’s say that we are getting comfortable with uncertainty and we are ready to gather some measurements from people so that we can describe them, make predictions about them, and/or understand causes of health-related phenomena in their lives. How exactly do we do that? Well, there are many different ways! However, because we generally can’t gather measurements from every single person in the population we are interested in, we almost always need to gather measurements from a smaller sample of people in the population we are interested in.
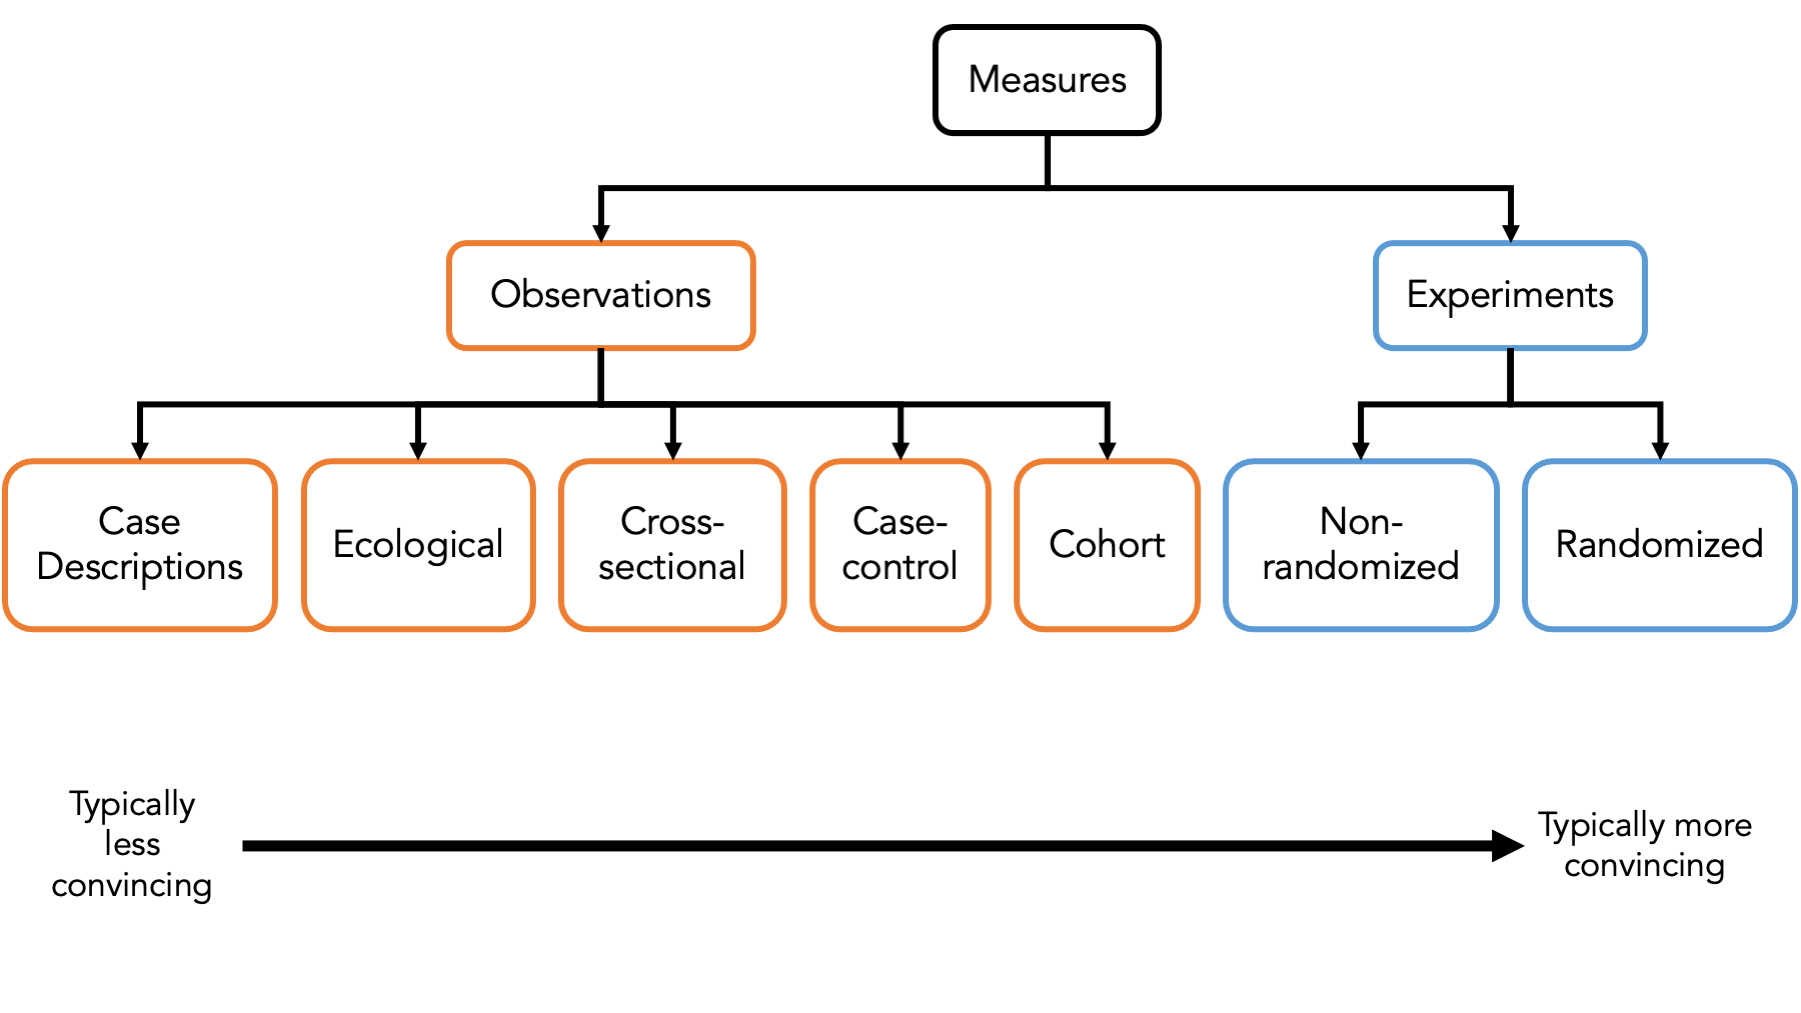
It’s important that we classify the different ways that we can sample people to gather measurements from because each of the different ways has its own set of strengths and weaknesses that we need to be aware of. In the figure above, we briefly introduce some of the most common ways to sample people – also known as study designs – used in epidemiology.
At the first first level, we typically categorize a study designs as either experimental or observational.
Experiments are studies in which the researcher has control over who is exposed to something and who isn’t. We will discuss a particular kind of experimental study – the randomized controlled trial – as a tool to help us understand causal inference later in the book.
In observational studies, the person, nature, society, or some force other than the researcher controls who is exposed to something and who isn’t. Observational studies make up the vast majority of epidemiologic studies. In particular, we will focus heavily on cross-sectional studies, case-control studies, and cohort studies in this book.
41.4 Summary
As we’ve already seen, R is a powerful tool for accessing, managing, analyzing, and presenting data. In the chapters that follow, we will learn how to use R to describe, predict, and explain health-related phenomena in populations of people. We will also use R to help ourselves develop a more concrete understanding of the key concepts related to correctly carrying out epidemiologic research.